Transform Data with Analysis Tools
In today's data-driven world, the sheer volume of information generated daily is staggering. From business transactions and social media interactions to scientific research and IoT device readings, data proliferates at an unprecedented rate. However, raw data, by itself, holds little value. It's only when this data is processed, analyzed, and interpreted that it transforms into actionable insights, revealing trends, patterns, and anomalies that can drive informed decisions. This is where data analysis tools become indispensable, serving as the essential bridge between raw information and meaningful understanding.

These powerful software applications and programming environments empower individuals and organizations to extract, clean, transform, model, and visualize data, turning complex datasets into clear, understandable narratives. They range from simple spreadsheet applications used for basic calculations to highly sophisticated platforms capable of performing advanced statistical modeling and machine learning algorithms on massive datasets. The right tools can unlock a competitive advantage, optimize operations, identify new opportunities, and mitigate risks.
The ability to harness data effectively is no longer a niche skill but a fundamental requirement across almost every industry. Businesses, researchers, and policymakers alike rely on robust data analysis capabilities to understand customer behavior, predict market trends, evaluate program effectiveness, and innovate their products and services. Without specialized tools, navigating the vast oceans of data would be an impossible, time-consuming, and error-prone task.

This article will delve into the world of data analysis tools, exploring their diverse types, key features, popular examples, and the profound benefits they offer. We will also discuss crucial considerations for choosing the most appropriate tools to meet specific analytical needs, ultimately demonstrating how they are revolutionizing the way we perceive and interact with information.
Understanding Data Analysis Tools
At their core, data analysis tools are software applications designed to help users perform various operations on data, from initial collection and cleaning to advanced statistical analysis and visualization. Their primary purpose is to uncover insights, correlations, and patterns that might not be immediately apparent in raw datasets. These tools provide the computational power and statistical functions necessary to process large volumes of data efficiently and accurately, far beyond what manual methods could achieve.
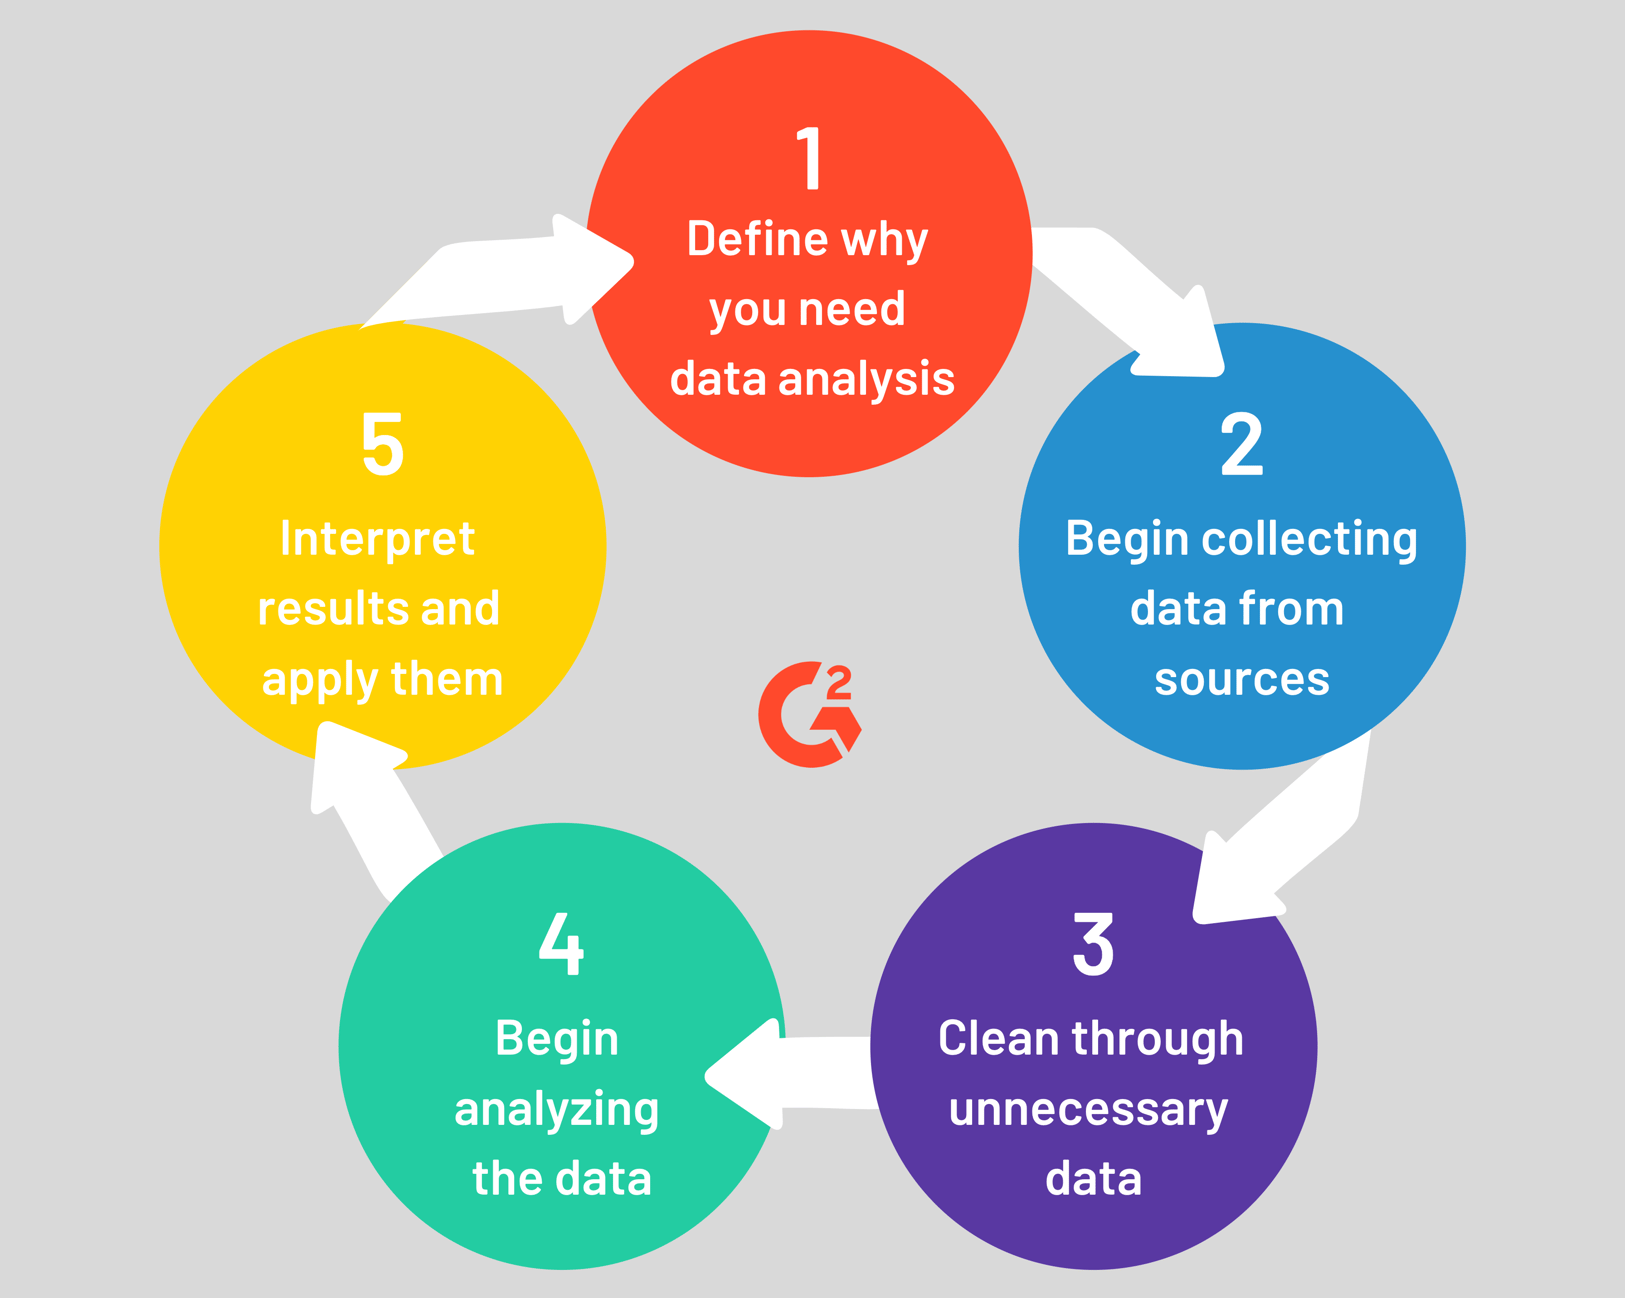
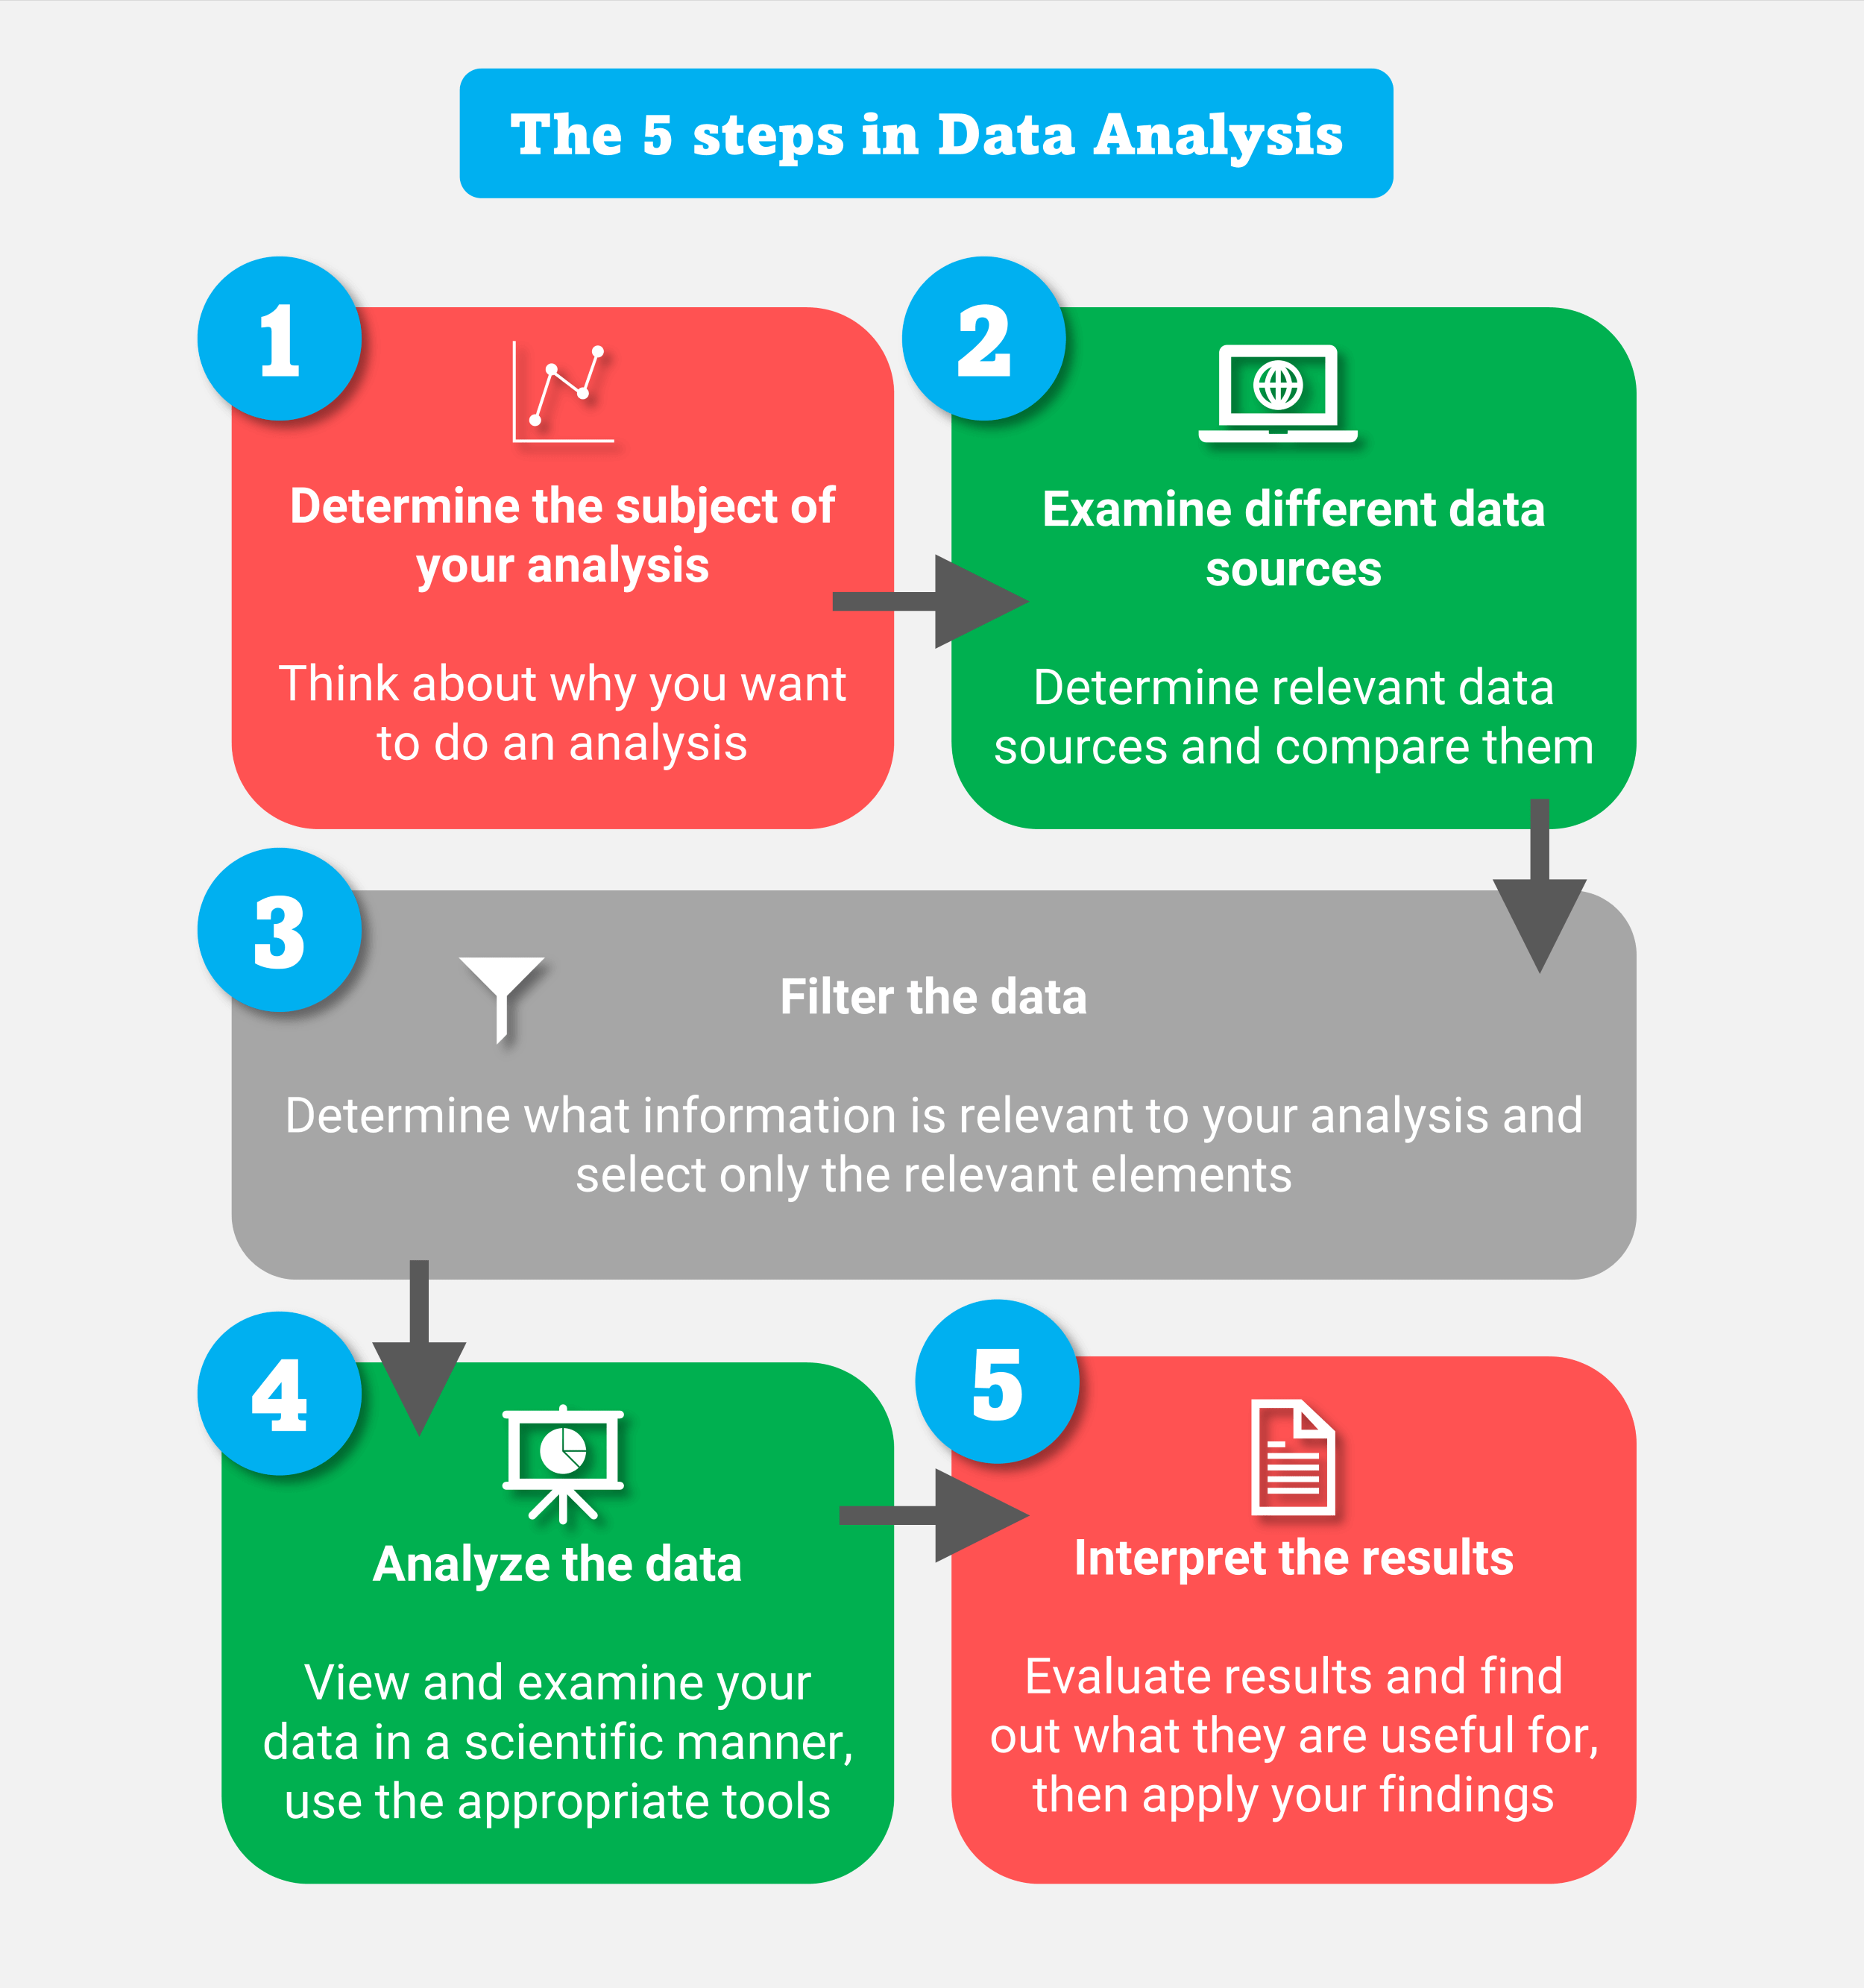
The scope of data analysis is broad, encompassing descriptive analytics (what happened?), diagnostic analytics (why did it happen?), predictive analytics (what will happen?), and prescriptive analytics (what should we do?). Each type of analysis often requires specific functionalities, and different tools are optimized to perform these tasks with varying degrees of complexity and scale. Regardless of their specialization, all data analysis tools aim to facilitate a clearer understanding of data, enabling better decision-making processes.
Diverse Types of Data Analysis Tools
The landscape of data analysis tools is vast and varied, categorized by their primary function, complexity, and target user. Understanding these categories helps in identifying the right tool for a specific analytical task or business need.

Business Intelligence (BI) Tools
BI tools focus on collecting, processing, and presenting business data to support decision-making. They often feature interactive dashboards, reporting capabilities, and data visualization elements that allow users to monitor key performance indicators (KPIs) and identify trends. They are generally user-friendly, catering to business users who need quick insights without deep technical knowledge.
Examples: Tableau, Microsoft Power BI, QlikView.

Statistical Analysis Software
These tools are designed for rigorous statistical modeling, hypothesis testing, and advanced quantitative analysis. They are heavily utilized in scientific research, econometrics, and highly data-driven fields. They offer a wide array of statistical functions, from regression analysis and ANOVA to time series forecasting.
Examples: SAS, IBM SPSS Statistics, Stata, Minitab.

Programming Languages for Data Analysis
For advanced users and data scientists, general-purpose programming languages equipped with powerful libraries provide the ultimate flexibility and control. These languages allow for complex data manipulation, custom algorithm development, machine learning, and highly customized visualizations. They require coding knowledge but offer unparalleled power.
Examples: Python (with libraries like Pandas, NumPy, Scikit-learn, Matplotlib, Seaborn), R (with packages like Tidyverse, ggplot2, Dplyr).
Data Visualization Tools
While many BI and programming tools include visualization capabilities, some specialized tools focus purely on creating compelling and interactive visual representations of data. They help communicate complex data stories in an understandable and engaging format.
Examples: Tableau Public, Plotly, D3.js (JavaScript library), Looker Studio (formerly Google Data Studio).
Spreadsheet Software
Often the entry point for many, spreadsheet software provides a powerful, yet accessible platform for data organization, basic calculations, and simple charting. While not ideal for massive datasets or complex analyses, they are ubiquitous and highly effective for smaller-scale data management and preliminary analysis.
Examples: Microsoft Excel, Google Sheets, LibreOffice Calc.
Database Query Tools
These tools allow users to interact directly with databases, extracting, filtering, and manipulating data using query languages like SQL (Structured Query Language). They are fundamental for data preparation and accessing information stored in relational databases before it's loaded into other analysis platforms.
Examples: MySQL Workbench, PgAdmin, Microsoft SQL Server Management Studio (SSMS).
Popular Data Analysis Tools in Detail
Let's explore some of the most widely used data analysis tools and their primary strengths.
Microsoft Excel
Microsoft Excel remains a powerhouse for data analysis, especially for small to medium-sized datasets. Its intuitive grid interface makes it easy to organize, sort, filter, and perform calculations. Features like pivot tables enable powerful summarization and cross-tabulation of data, while built-in functions cover a wide range of statistical and financial analyses. It's widely accessible and forms the foundation for many initial data exploration tasks.
Tableau
Tableau is a leading BI and data visualization tool known for its user-friendly drag-and-drop interface and ability to create stunning, interactive dashboards. It connects to various data sources and allows users to explore data visually, identifying patterns and trends quickly. Tableau Desktop, Tableau Server, and Tableau Public offer options for individual users, enterprises, and public sharing, respectively.
Microsoft Power BI
Microsoft Power BI is another prominent BI tool, deeply integrated with the Microsoft ecosystem. It allows users to connect to hundreds of data sources, transform data, and create rich, interactive reports and dashboards. Power BI's strength lies in its ability to handle large datasets, its powerful DAX (Data Analysis Expressions) language for advanced calculations, and its cost-effectiveness for many organizations already invested in Microsoft products.
Python
Python has become the go-to language for data science due to its simplicity, extensive libraries, and vast community support. Key libraries include:
* Pandas: For data manipulation and analysis, providing powerful data structures like DataFrames.
* NumPy: For numerical computing, especially array operations.
* Matplotlib and Seaborn: For creating high-quality static and statistical visualizations.
* Scikit-learn: For machine learning algorithms.
Python's versatility means it can handle everything from data cleaning and exploration to building complex predictive models.
R
R is a language and environment specifically designed for statistical computing and graphics. It boasts an unparalleled collection of packages (CRAN repository) for virtually every statistical method imaginable, making it a favorite among statisticians and researchers. ggplot2 for visualization and the Tidyverse collection of packages for data manipulation are particularly popular.
SQL
SQL (Structured Query Language) is not an analytical tool in itself but a foundational language for interacting with relational databases. It's crucial for extracting, filtering, and joining data from large databases before it can be used in other analytical tools. Proficiency in SQL is a fundamental skill for anyone working with data.
Key Features and Capabilities of Modern Data Analysis Tools
Effective data analysis tools share several common features that contribute to their utility and power:
Data Integration and Preparation
Modern tools must be able to connect to diverse data sources (databases, cloud services, spreadsheets, APIs) and offer functionalities for data cleaning, transformation, and merging. This includes handling missing values, standardizing formats, and resolving inconsistencies, which is often the most time-consuming part of the analysis process.
Exploratory Data Analysis (EDA)
Tools provide functions to summarize and visualize the main characteristics of data, often with visual methods. This helps in understanding the data's structure, distribution, and identifying initial patterns or outliers.
Advanced Analytics and Machine Learning Integration
Many tools, especially programming languages and some BI platforms, now integrate advanced statistical models and machine learning algorithms. This allows users to move beyond descriptive analysis to predictive modeling, classification, clustering, and anomaly detection.
Reporting and Dashboarding
The ability to create clear, concise, and interactive reports and dashboards is critical for communicating insights. Good tools allow for customization, drill-down capabilities, and easy sharing of findings with stakeholders.
Scalability and Performance
As data volumes grow, tools must be able to handle increasingly large datasets without significant performance degradation. This involves efficient data processing engines and, for enterprise solutions, distributed computing capabilities.
Collaboration Features
In team environments, tools that facilitate sharing, version control, and collaborative development of analyses and reports are highly valued.
Benefits of Leveraging Data Analysis Tools
The strategic adoption of data analysis tools offers a multitude of benefits across various sectors:
Informed Decision-Making
By transforming raw data into clear, actionable insights, these tools empower organizations to make evidence-based decisions rather than relying on intuition or guesswork. This leads to better strategic planning, operational efficiency, and problem-solving.
Efficiency and Automation
Tools automate many repetitive tasks involved in data processing, cleaning, and reporting. This frees up analysts' time to focus on higher-value activities like interpretation and strategic thinking, significantly improving productivity.
Identification of Trends and Patterns
Sophisticated algorithms within these tools can uncover hidden correlations, emerging trends, and subtle patterns that would be impossible to detect manually. This can lead to new product development, optimized marketing campaigns, or early detection of risks.
Competitive Advantage
Organizations that effectively leverage data analysis can gain a significant edge over competitors. They can respond more quickly to market changes, understand customer needs better, optimize pricing, and streamline supply chains.
Risk Mitigation
By identifying anomalies, potential fraud, or operational bottlenecks through data analysis, businesses can proactively address issues, reduce losses, and enhance security.
Choosing the Right Data Analysis Tools for Your Needs
Selecting the appropriate data analysis tools is a critical decision that depends on several factors:
Define Your Analytical Needs and Goals
What questions are you trying to answer? What kind of data do you have? Are you doing descriptive analysis, predictive modeling, or real-time monitoring? Your objectives will dictate the type of tools required.
Consider Data Volume and Velocity
For small, static datasets, Excel might suffice. For terabytes of streaming data, you'll need scalable, high-performance solutions like cloud-based BI tools or programming languages running on big data platforms.
User Skill Level and Team Expertise
Do your team members have coding skills (Python, R, SQL) or prefer a more visual, drag-and-drop interface (Tableau, Power BI)? Choose tools that align with your team's existing capabilities or for which training resources are readily available.
Integration with Existing Systems
Ensure the chosen tools can seamlessly connect with your current data sources, databases, CRM systems, and other business applications to avoid data silos and manual data transfers.
Cost and Scalability
Evaluate the licensing costs, infrastructure requirements, and potential long-term expenses. Consider whether the tool can scale with your growing data volume and analytical demands.
Vendor Support and Community
A strong vendor support system, comprehensive documentation, and an active user community can be invaluable for troubleshooting, learning, and staying updated with new features.
Conclusion
The ability to transform raw data into actionable insights is a defining characteristic of successful organizations in the 21st century. Data analysis tools are not just software; they are catalysts for informed decision-making, innovation, and competitive advantage. From the foundational capabilities of spreadsheets to the sophisticated algorithms of programming languages and the intuitive interfaces of modern BI platforms, these tools empower individuals and businesses to uncover hidden truths within their data.
As data continues to grow in volume, velocity, and variety, the demand for proficient data analysts and powerful, adaptable tools will only intensify. By carefully selecting and strategically deploying the right data analysis tools, organizations can unlock their full data potential, driving efficiency, identifying opportunities, mitigating risks, and ultimately shaping a more data-driven and intelligent future. Embracing these technologies is no longer an option but a necessity for thriving in the modern landscape.