Unlock Value with Market Cap Tracking
In the dynamic world of financial markets, investors constantly seek clarity amidst a deluge of data. Understanding the true scale and potential of a company is paramount, and this often begins with its market capitalization. For both seasoned investors and newcomers, effective Market Cap Tracking emerges as an indispensable practice, providing a lens through which to assess a company's standing, its risk profile, and its growth trajectory within the broader economic landscape. It's more than just a number; it's a critical indicator that informs strategic investment decisions, portfolio diversification, and ultimately, the pursuit of long-term financial goals.
The concept of market capitalization, or "market cap," represents the total value of a company's outstanding shares. It is calculated by multiplying the current share price by the total number of its shares currently available in the market. This simple calculation provides a quick snapshot of a company's size, which, in turn, often correlates with its stability, growth prospects, and susceptibility to market fluctuations. Tracking these values over time allows investors to identify trends, gauge market sentiment, and respond proactively to shifts in valuation.
Beyond individual stock analysis, market cap also defines distinct categories of companies, commonly segmented into large-cap, mid-cap, and small-cap. Each segment carries unique characteristics regarding risk, growth potential, and liquidity. Large-cap companies, often established industry leaders, typically offer stability and consistent dividends, while small-cap companies may present higher growth potential but also increased volatility. Market Cap Tracking enables investors to strategically allocate capital across these segments, balancing risk and reward according to their individual investment objectives and risk tolerance.
The ability to consistently monitor and analyze market capitalization trends can unveil hidden opportunities and provide early warnings of potential downturns. It helps investors understand how capital flows across different company sizes and sectors, reflecting broader economic narratives and investor preferences. By integrating this practice into their analytical routine, individuals can build more resilient portfolios and make data-driven choices that align with their financial aspirations.
What is Market Capitalization and Why Does it Matter?
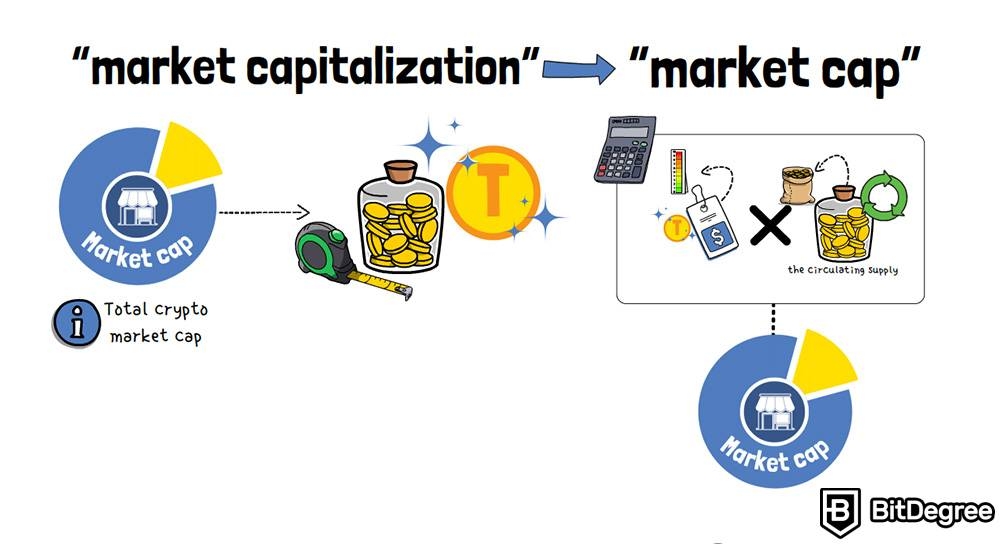
Market capitalization is fundamentally the aggregate value of a company's shares traded on the stock exchange. It's determined by a straightforward formula: Market Capitalization = Share Price × Number of Outstanding Shares. This metric is often the first point of reference for investors to gauge a company's size, and by extension, its relative prominence and influence within its industry and the overall economy. For instance, a company with a share price of $100 and 100 million outstanding shares would have a market cap of $10 billion.
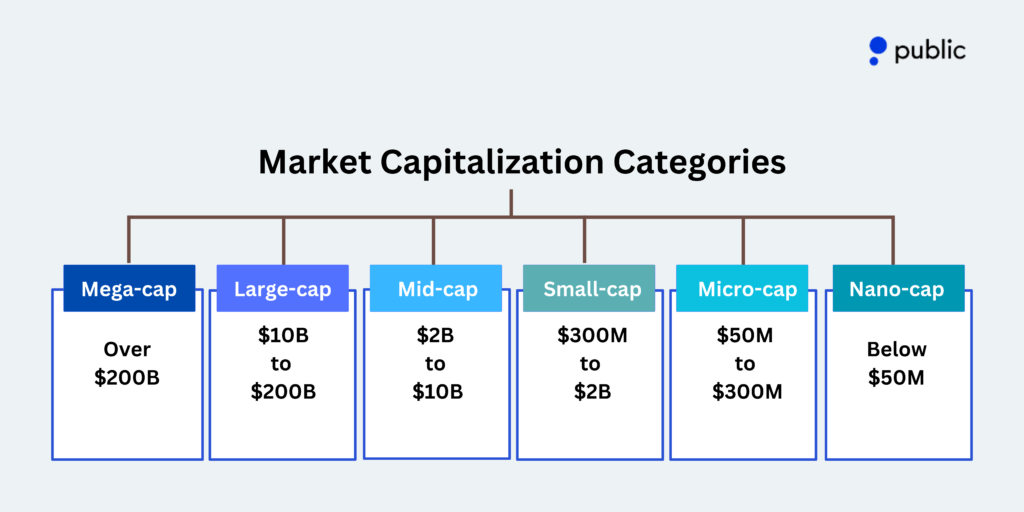
The significance of market capitalization extends beyond a mere numerical representation of size. It acts as a primary categorizing factor for companies, influencing how they are perceived by investors and how they behave in the market. Generally, companies are grouped into broad market cap categories:
- Large-Cap Companies: Typically valued at $10 billion or more. These are often well-established, blue-chip companies with a long history of operations, strong brand recognition, and stable earnings. Examples include multinational corporations that dominate their respective industries. Investors often favor large-cap stocks for their stability, liquidity, and potential for consistent dividend payouts.
- Mid-Cap Companies: Generally valued between $2 billion and $10 billion. These companies are often in a growth phase, expanding their market share or entering new markets. They can offer a balance of growth potential and relative stability, though they may experience more volatility than large-cap stocks.
- Small-Cap Companies: Valued between $300 million and $2 billion. These are often younger, emerging companies with significant growth potential but also higher risk. They can be highly volatile, but successful small-cap investments can yield substantial returns.
- Micro-Cap Companies: Typically valued below $300 million. These are often new or niche companies with very high growth potential but also the highest risk and lowest liquidity.
Understanding these distinctions is crucial because a company's market cap category often dictates its risk-reward profile, liquidity, and investment characteristics. Market Cap Tracking allows investors to monitor shifts in these categories, informing their portfolio allocation strategies and helping them identify companies that might be transitioning between categories, signalling significant changes in their business or market perception.
The Strategic Importance of Market Cap Tracking for Investors

Market Cap Tracking is far more than a simple analytical exercise; it's a strategic imperative for informed decision-making in the investment landscape. This practice provides invaluable insights into a company's maturity, growth phase, risk profile, and its potential contribution to a diversified portfolio. By understanding how a company's market capitalization evolves, investors can gain a deeper comprehension of market dynamics and refine their investment approaches.
Assessing Risk and Volatility
Market capitalization often correlates directly with a company's risk profile. Large-cap companies, due to their established presence, diversified operations, and substantial financial resources, tend to be more stable and less volatile. They are generally better equipped to weather economic downturns and market fluctuations. Conversely, small-cap and micro-cap companies are inherently riskier. Their smaller size means they might be more susceptible to economic shifts, competitive pressures, or adverse events. They often have less financial resilience and their share prices can exhibit significant volatility. Tracking market cap helps investors gauge the inherent risk associated with different investments and ensures their portfolio's risk exposure aligns with their personal tolerance.
Identifying Growth Potential
While large-caps offer stability, small-caps often represent the engine of significant growth. Many companies that eventually become large-caps started as small or mid-caps. Market Cap Tracking allows investors to identify emerging companies with innovative products or services that have the potential for rapid expansion. A company steadily growing its market cap could indicate successful business execution, increasing market share, or a positive shift in investor sentiment. For growth-oriented investors, pinpointing these rising stars early on can lead to substantial long-term returns.
Enhancing Portfolio Diversification
A well-diversified portfolio balances various asset classes, industries, and geographic regions. Importantly, it should also include diversification across market capitalization segments. Relying solely on large-cap stocks might offer stability but could limit growth potential. Conversely, an exclusive focus on small-caps could expose a portfolio to excessive volatility. By tracking market cap, investors can ensure their portfolio includes a healthy mix of large, mid, and small-cap companies, optimizing the balance between stability, growth, and risk. For example, a common strategy is to allocate a larger portion to large-caps for a foundational layer of stability, complemented by smaller allocations to mid and small-caps for growth.
Understanding Liquidity
Liquidity refers to how easily an asset can be converted into cash without affecting its market price. Generally, large-cap stocks are highly liquid, meaning they can be bought and sold quickly without significant price impact due to high trading volumes. Small-cap and especially micro-cap stocks often have lower liquidity, which can make it challenging to enter or exit positions quickly without impacting the share price. This is a crucial consideration for traders and investors who may need to adjust their holdings frequently. Market Cap Tracking provides insights into the general liquidity profile of companies within different size brackets.
Advanced Market Cap Tracking: Beyond the Basics
While understanding the fundamentals of market capitalization and its broad categories is essential, truly unlocking value requires an advanced approach to Market Cap Tracking. This involves integrating market cap data with other financial metrics, considering industry-specific nuances, and leveraging sophisticated tools for analysis.
Combining Market Cap with Valuation Metrics
Market cap alone doesn't tell the whole story of a company's value. A large market cap doesn't necessarily mean a company is overvalued, just as a small market cap doesn't automatically imply undervaluation. It's crucial to cross-reference market cap with other key valuation metrics such as:
- Price-to-Earnings (P/E) Ratio: Compares a company's share price to its earnings per share. A high P/E might suggest investors expect high future growth, but it could also indicate overvaluation.
- Price-to-Book (P/B) Ratio: Compares a company's market cap to its book value (assets minus liabilities). It helps assess if a company is trading above or below its asset value.
- Enterprise Value (EV): Often considered a more comprehensive valuation metric than market cap as it includes total debt and subtracts cash, providing a more accurate picture of the company's total value, especially useful for M&A analysis.
- Debt-to-Equity Ratio: While not a direct valuation metric, understanding a company's leverage relative to its market cap provides crucial insight into its financial health and risk.
By using Market Cap Tracking in conjunction with these ratios, investors can identify whether a company's size is justified by its earnings, assets, or overall financial structure. For instance, a small-cap company with a rapidly growing market cap might still be a good investment if its P/E ratio is reasonable given its growth prospects.
Sector-Specific and Industry-Specific Analysis
The significance of market cap can vary considerably across different sectors and industries. For example, a "large-cap" company in the biotech sector might have a lower market cap than a "mid-cap" company in the technology sector simply due to the differing capital intensity, maturity, and growth characteristics of these industries.
Advanced Market Cap Tracking involves:
- Comparing within industry: Instead of just comparing a biotech company's market cap to a large bank, compare it to other biotech companies. This helps identify industry leaders, challengers, and niche players within their specific competitive landscape.
- Tracking sector trends: Monitoring the collective market cap movement of entire sectors can reveal shifts in investor preference or economic trends. For instance, a general increase in the market cap of renewable energy companies might signal a growing interest in sustainable investments.
This nuanced approach helps investors avoid apples-to-oranges comparisons and provides a more accurate assessment of a company's relative position and potential within its relevant market.
Tools and Technologies for Effective Market Cap Tracking

In today's fast-paced financial markets, relying on manual calculations for Market Cap Tracking is inefficient and often impractical. Fortunately, a wide array of tools and technologies are available to help investors monitor, analyze, and interpret market capitalization data in real-time.
Financial News and Data Portals
Many popular financial websites and news platforms offer comprehensive stock quotes that include market capitalization data. These platforms often provide:
- Real-time or near real-time market cap updates: Essential for tracking volatile stocks.
- Historical market cap data: Useful for analyzing trends over time.
- Screeners: Tools that allow users to filter stocks based on various criteria, including market cap, to identify potential investment opportunities within specific size ranges.
- Company profiles: Detailed information about a company, including its financials, industry, and competitors.
Examples include Yahoo Finance, Google Finance, Bloomberg, Reuters, and various brokerage firm portals. These are excellent starting points for individual investors seeking general market cap information.
Brokerage Platforms and Investment Software
Most online brokerage platforms provide integrated tools for Market Cap Tracking as part of their trading and analysis suites. These platforms often offer:
- Portfolio tracking: Automatically updates the market cap of holdings in an investor's portfolio.
- Advanced charting tools: Visual representations of market cap trends alongside price movements, volume, and other technical indicators.
- Research reports: Access to analyst reports that often incorporate market cap analysis.
- Alerts: Customizable notifications for changes in market cap or when a stock crosses a certain market cap threshold.
For more sophisticated analysis, dedicated investment software and platforms (e.g., Bloomberg Terminal for professionals, or specialized retail platforms like Koyfin, Finviz) offer highly granular data, customizable dashboards, and powerful analytical capabilities designed for in-depth Market Cap Tracking and comparative analysis across various segments.
APIs for Custom Solutions
For advanced users, developers, or institutional investors, financial APIs (Application Programming Interfaces) offer the ultimate flexibility for Market Cap Tracking. These APIs allow users to programmatically access vast amounts of financial data, including real-time and historical market capitalization, directly into custom applications, spreadsheets, or algorithms. This enables:
- Automated data collection: Eliminating manual data entry.
- Algorithmic trading strategies: Incorporating market cap as a criterion for automated buy/sell decisions.
- Custom dashboards and visualizations: Building unique analytical tools tailored to specific investment strategies.
- Integration with other data sources: Combining market cap with proprietary data sets for richer insights.
Examples of financial data APIs include those from Alpaca, IEX Cloud, and FactSet. While requiring technical expertise, these APIs provide unparalleled power for comprehensive and dynamic Market Cap Tracking.
Potential Pitfalls and Considerations in Market Cap Tracking
While Market Cap Tracking is a powerful analytical tool, it's not without its limitations and potential pitfalls. Investors must be aware of these considerations to avoid making decisions based on an incomplete or misleading picture.
Market Cap Volatility
Market capitalization is directly tied to a company's share price, which can be highly volatile, especially for smaller companies or during periods of market uncertainty. A significant price fluctuation, even if temporary, can dramatically alter a company's market cap, potentially moving it between categories (e.g., from mid-cap to large-cap) in a short period. This volatility means that market cap is a constantly changing metric, and relying on a single snapshot can be misleading. Continuous Market Cap Tracking is necessary to understand the true trend and avoid overreacting to short-term swings.
Influence of Stock Splits, Reverse Splits, and Buybacks
A company's market cap calculation involves the number of outstanding shares. Corporate actions such as stock splits, reverse stock splits, and share buybacks directly impact this number:
- Stock Split: Increases the number of shares outstanding while proportionally decreasing the share price, leaving the total market cap unchanged. An investor might mistakenly perceive a sudden increase in shares as a change in value.
- Reverse Stock Split: Decreases the number of shares outstanding while proportionally increasing the share price, again leaving the market cap the same.
- Share Buyback: A company repurchases its own shares from the open market, reducing the number of outstanding shares. This can artificially inflate the earnings per share (EPS) and potentially the share price, but the market cap accurately reflects the reduced share count.
It's crucial to understand these actions and their impact on the share count to correctly interpret market cap movements. A change in market cap due to a buyback is a genuine reduction in the company's outstanding value, whereas a split is merely an accounting adjustment.
Liquidity Issues in Smaller Caps
As mentioned earlier, smaller market cap companies often have lower trading volumes, leading to lower liquidity. This can mean that large buy or sell orders can disproportionately impact the stock price, leading to significant fluctuations not necessarily reflective of the company's underlying value or performance. Investors dealing with micro-cap or illiquid small-cap stocks must exercise caution, as entering or exiting positions can be challenging and potentially costly. Market Cap Tracking should include an assessment of average daily trading volume to gauge actual liquidity.
Not a Sole Indicator of Value
Market capitalization is an excellent indicator of size and can offer insights into risk and growth profiles, but it is not a standalone measure of a company's financial health, intrinsic value, or investment quality. A high market cap doesn't guarantee a good investment, nor does a low market cap automatically signal a bargain. For instance, a large-cap company could be overvalued or facing severe fundamental issues, while a small-cap company could be a high-quality, undervalued gem.
Effective investing requires combining Market Cap Tracking with a holistic analysis that includes:
- Fundamental analysis: Examining financial statements (revenue, profit, debt, cash flow), management quality, competitive landscape, and industry trends.
- Valuation analysis: Using metrics like P/E, P/B, DCF (Discounted Cash Flow) to determine if a stock is fairly priced relative to its earnings potential and assets.
- Qualitative factors: Brand strength, innovation, intellectual property, corporate governance, and ethical practices.
By understanding these nuances, investors can leverage market cap data effectively as one crucial piece of a much larger, more comprehensive investment puzzle.
Conclusion
In the multifaceted world of stock market investing, understanding and utilizing market capitalization is fundamental to constructing a robust and well-informed portfolio. Market Cap Tracking serves as an essential compass, guiding investors through the diverse landscape of companies, from established giants to nimble startups. It offers a crucial lens for assessing a company's size, its inherent risk profile, its growth trajectory, and its potential liquidity, all of which are vital considerations for strategic asset allocation.
By diligently monitoring market cap trends, investors can gain profound insights into market sentiment, identify emerging opportunities, and better manage the overall risk exposure of their portfolios. While market capitalization provides a powerful initial framework, its true value is unlocked when integrated with other key financial metrics, such as P/E ratios and enterprise value, and considered within the specific context of industry and sector dynamics. Furthermore, leveraging modern financial tools and technologies ensures that this vital data is accessible and actionable in real-time.
However, smart investors also recognize the limitations of market cap as a standalone metric. Its inherent volatility and susceptibility to corporate actions like stock splits necessitate a nuanced understanding. It should always be viewed as one critical component of a comprehensive investment analysis, complemented by thorough fundamental research and qualitative assessments. Ultimately, embracing effective Market Cap Tracking empowers investors to make more confident, data-driven decisions, optimize their diversification strategies, and enhance their potential for long-term success in an ever-evolving market.